Data Observability

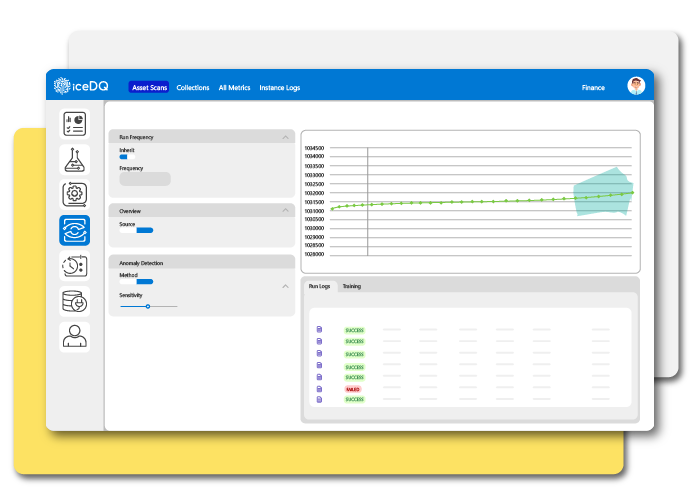
AI based anomaly detection at scale.

Leverage AI to automatically detect, analyze, and report data anomalies to:

  • – Minimize Downtime
  • – Improve Customer Experience
  • – Ensure Business Continuity

For a more in-depth explanation, refer to Data Observability Concepts.
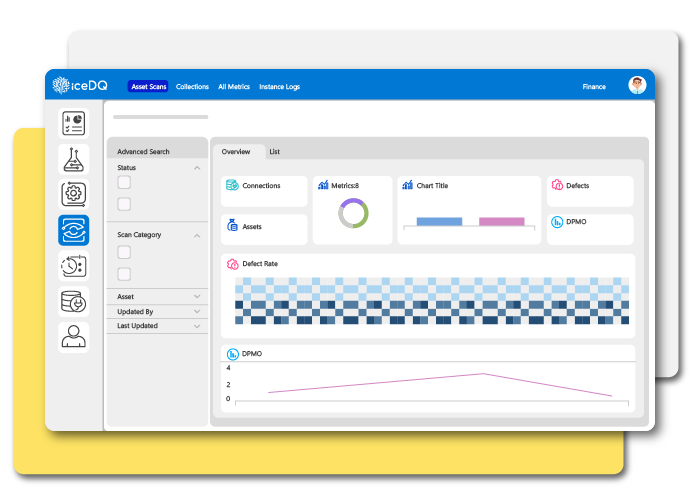
USE CASES

HOW IT WORKS?

KEY BENEFITS

Improve Productivity with AI - iceDQImprove Productivity with AITriple Arrow - iceDQiceDQ learns the data patterns and automatically creates metrics to detect and notify data anomalies. This enables data certification at enterprise scale with minimal human effort.
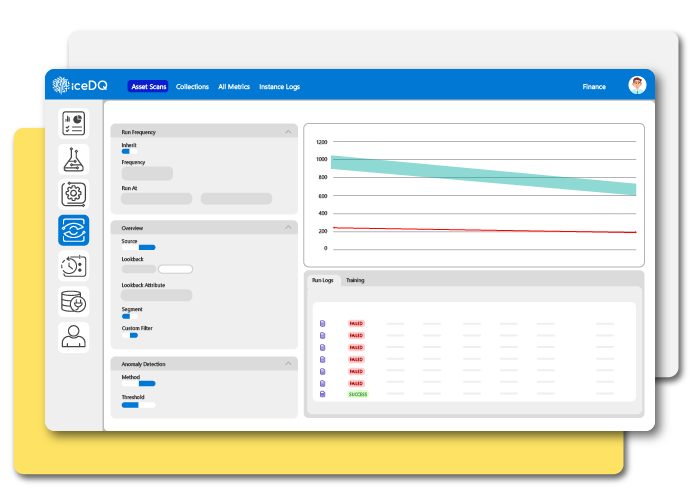
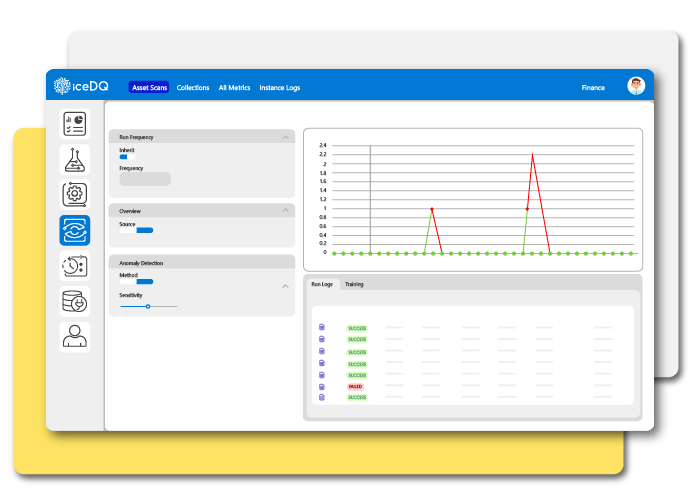
Support Complex Use cases - iceDQSupport Complex Use casesTriple Arrow - iceDQThe data observability platform supports both AI and rules-based methodologies to uncover complex data issues.
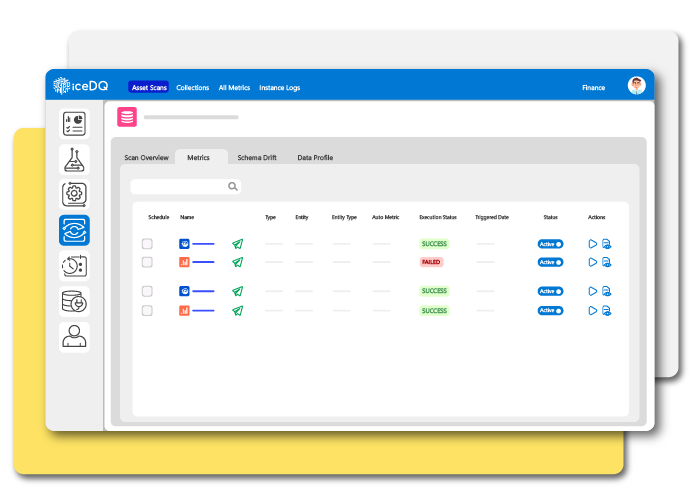
Powerful Triage Capabilities  - iceDQPowerful Triage CapabilitiesTriple Arrow - iceDQUnlike simpler data observability platforms limited to working at the aggregate level, iceDQ offers pre-built capabilities to identify exceptions at both the record and column level.
Built for Data Governance - iceDQ - iceDQBuilt for Data GovernanceTriple Arrow - iceDQProvides feedback to data stewards and data owners with quality scores for effective data governance.
Integrated with Production Monitoring - iceDQ   - iceDQIntegrated with Production MonitoringTriple Arrow - iceDQEliminate silos with iceDQ's integrated data testing, monitoring, and observability platform. This enables quick diagnosis and remediation of data issues before they impact business processes or user experience.

FEATURES

  • AUTOMETRICS
    The system offers built-in data profiling and automatic metric generation. This enables rapid scaling of observability.
  • SEGMENTED METRICS
    Observations of large tables can be grouped into different categories, such as department or source, for easier reporting.
  • MACRO & MICRO METRICS
    While macro-observability focuses on anomaly detection at the aggregate level, iceDQ offers additional features for micro-level data observation.
  • DATA FRESHNESS
    Check the freshness of data and file arrival or delivery against historic patterns or SLAs.
  • DATA VOLUME
    Compare data volumes, counts, and sums against historical patterns or user-defined rules to identify anomalies.
Autometrics-iceDQ
Segment Metrics - iceDQ
Macro and Micro Metrics - iceDQ
Data Freshness - iceDQ
Data Volume - iceDQ
iceDQ-Tool-Page-CTA
iceDQ Tool Page CTA

FAQs

Do you use a database for processing?

No. We have our proprietary High-performance in-memory engine and a scalable big-data engine. This helps lower your database load and costs.

Where is the software deployed?

Companies can opt for the SaaS option on AWS or the self-managed on-premises options.

Do you have access to our data?

No. The customer controls data access for both the SaaS and on-premises option.

What is the license based on?

It’s a consumption-based license per user per server or enterprise.